
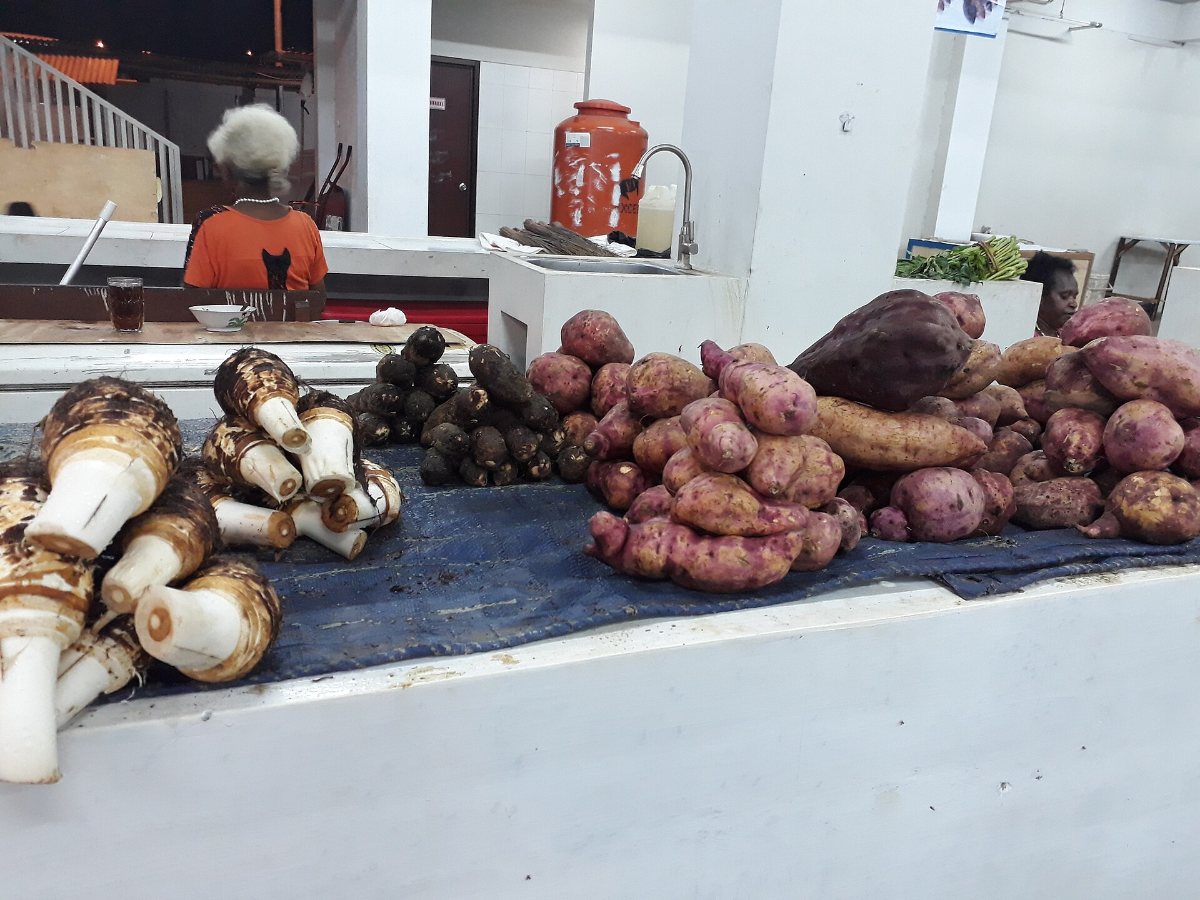
This page publishes the official Papua food security index scores for all 42 regencies and cities in Indonesia’s six Papuan provinces for 2024, 2025 and 2026. The scores come from the Food Security Index (Indeks Ketahanan Pangan, IKP) open dataset of Indonesia’s National Food Agency (Badan Pangan Nasional, Bapanas). In addition, Papua Movement has extracted the Papuan rows, translated the labels into English and calculated the averages shown below.
Last updated: 20 November 2026. Source data downloaded from Bapanas on 20 November 2026.
Key figures for 2026
- All 18 regencies rated “very vulnerable” in Indonesia are in the Papuan provinces, down from 23 Papuan regencies in 2024.
- In particular, the agency rates all eight regencies of Highland Papua as very vulnerable. Puncak (Central Papua) has the lowest score in Indonesia, 20.4 out of 100.
- The 42 Papuan regencies and cities average 48.2, against 73.8 for Indonesia’s other 472 regencies and cities.
- The widest gap is in availability: 32.2 in Papua against 63.6 elsewhere. Papua’s average availability score has barely changed since 2024 (32.3).
- The highest Papuan score is Merauke Regency in South Papua, 69.3, ranked 360th of 514.
For an explanation of what these numbers mean and why the highlands score lowest, see Papua Food Security: Why the Highlands Rank Lowest in Indonesia.
Papua food security index: averages by province
| Province | Regencies and cities | IKP 2026 | Availability | Affordability | Utilisation | IKP 2024 | Change | Very vulnerable (2026) |
|---|---|---|---|---|---|---|---|---|
| Papua | 9 | 53.6 | 34.2 | 66.2 | 60.5 | 52.2 | +1.4 | 2 |
| West Papua | 7 | 56.0 | 42.1 | 73.7 | 52.4 | 53.3 | +2.7 | 1 |
| Southwest Papua | 6 | 55.2 | 35.7 | 74.0 | 56.3 | 50.4 | +4.8 | 0 |
| Central Papua | 8 | 40.4 | 27.5 | 57.6 | 36.6 | 40.8 | -0.4 | 6 |
| Highland Papua | 8 | 35.7 | 18.7 | 62.1 | 26.8 | 35.3 | +0.4 | 8 |
| South Papua | 4 | 52.7 | 41.7 | 63.9 | 52.7 | 47.5 | +5.2 | 1 |
| All six provinces | 42 | 48.2 | 32.2 | 65.9 | 46.8 | 46.3 | +1.9 | 18 |
| Rest of Indonesia | 472 | 73.8 | 63.6 | 86.5 | 71.4 | 70.0 | +3.8 | 0 |
Papua food security index scores for all 42 regencies and cities
The tables below list each province separately, sorted by 2026 score. For comparison, the national rank is out of 514 regencies and cities, where 1 is the most food secure.
Food security index scores in Papua province
| Regency or city | IKP 2026 | IKP 2024 | Change | Availability | Affordability | Utilisation | Rank (of 514) | Status 2026 |
|---|---|---|---|---|---|---|---|---|
| Jayapura Regency | 64.2 | 64.9 | -0.6 | 44.6 | 78.5 | 69.8 | 424 | Somewhat resilient |
| Jayapura City | 61.7 | 64.9 | -3.2 | 29.2 | 83.6 | 72.7 | 444 | Somewhat resilient |
| Sarmi Regency | 60.9 | 57.3 | +3.6 | 48.2 | 73.7 | 60.9 | 452 | Somewhat vulnerable |
| Kepulauan Yapen Regency | 59.8 | 49.4 | +10.4 | 55.1 | 60.6 | 63.5 | 457 | Somewhat vulnerable |
| Keerom Regency | 54.1 | 46.2 | +7.9 | 38.0 | 67.0 | 57.5 | 484 | Somewhat vulnerable |
| Biak Numfor Regency | 51.3 | 44.8 | +6.5 | 23.9 | 65.7 | 64.6 | 488 | Vulnerable |
| Supiori Regency | 46.9 | 48.5 | -1.7 | 28.7 | 56.0 | 56.0 | 496 | Vulnerable |
| Waropen Regency | 45.0 | 48.8 | -3.8 | 19.7 | 59.5 | 56.0 | 497 | Very vulnerable |
| Mamberamo Raya Regency | 38.2 | 45.0 | -6.8 | 20.5 | 51.2 | 43.0 | 503 | Very vulnerable |
Food security index scores in West Papua province
| Regency or city | IKP 2026 | IKP 2024 | Change | Availability | Affordability | Utilisation | Rank (of 514) | Status 2026 |
|---|---|---|---|---|---|---|---|---|
| Kaimana Regency | 63.7 | 63.4 | +0.3 | 52.1 | 80.9 | 58.4 | 427 | Somewhat resilient |
| Manokwari Regency | 62.9 | 66.0 | -3.1 | 48.0 | 74.6 | 66.2 | 437 | Somewhat resilient |
| Teluk Bintuni Regency | 61.0 | 52.9 | +8.2 | 53.3 | 74.9 | 55.1 | 450 | Somewhat vulnerable |
| Teluk Wondama Regency | 58.6 | 44.6 | +14.0 | 55.3 | 70.6 | 50.1 | 464 | Somewhat vulnerable |
| Manokwari Selatan Regency | 58.6 | 60.4 | -1.8 | 50.3 | 73.3 | 52.4 | 465 | Somewhat vulnerable |
| Fakfak Regency | 50.3 | 50.5 | -0.2 | 24.1 | 77.3 | 49.9 | 490 | Vulnerable |
| Pegunungan Arfak Regency | 36.8 | 35.0 | +1.7 | 11.7 | 64.3 | 34.6 | 505 | Very vulnerable |
Food security index scores in Southwest Papua province
| Regency or city | IKP 2026 | IKP 2024 | Change | Availability | Affordability | Utilisation | Rank (of 514) | Status 2026 |
|---|---|---|---|---|---|---|---|---|
| Sorong City | 61.6 | 59.0 | +2.6 | 33.2 | 81.8 | 70.1 | 446 | Somewhat resilient |
| Raja Ampat Regency | 58.4 | 56.8 | +1.6 | 41.9 | 78.2 | 55.5 | 467 | Somewhat vulnerable |
| Maybrat Regency | 56.6 | 42.8 | +13.8 | 39.3 | 70.8 | 59.7 | 474 | Somewhat vulnerable |
| Sorong Selatan Regency | 54.9 | 46.3 | +8.5 | 36.1 | 77.5 | 51.3 | 481 | Somewhat vulnerable |
| Sorong Regency | 53.1 | 53.2 | -0.1 | 37.3 | 65.5 | 56.6 | 485 | Vulnerable |
| Tambrauw Regency | 46.9 | 44.1 | +2.8 | 26.1 | 70.2 | 44.9 | 495 | Vulnerable |
Food security index scores in Central Papua province
| Regency or city | IKP 2026 | IKP 2024 | Change | Availability | Affordability | Utilisation | Rank (of 514) | Status 2026 |
|---|---|---|---|---|---|---|---|---|
| Mimika Regency | 68.1 | 65.9 | +2.2 | 59.5 | 81.5 | 63.6 | 391 | Somewhat resilient |
| Nabire Regency | 63.3 | 61.4 | +1.8 | 48.5 | 75.2 | 66.3 | 431 | Somewhat resilient |
| Puncak Jaya Regency | 37.9 | 34.0 | +3.9 | 15.8 | 58.5 | 39.6 | 504 | Very vulnerable |
| Paniai Regency | 35.8 | 33.2 | +2.6 | 24.6 | 52.6 | 30.6 | 506 | Very vulnerable |
| Deiyai Regency | 33.7 | 31.9 | +1.8 | 20.9 | 54.0 | 26.6 | 508 | Very vulnerable |
| Intan Jaya Regency | 33.1 | 31.1 | +2.0 | 21.5 | 51.6 | 26.5 | 509 | Very vulnerable |
| Dogiyai Regency | 31.2 | 36.3 | -5.2 | 20.3 | 48.2 | 25.2 | 511 | Very vulnerable |
| Puncak Regency | 20.4 | 32.5 | -12.0 | 8.5 | 38.7 | 14.3 | 514 | Very vulnerable |
Food security index scores in Highland Papua province
| Regency or city | IKP 2026 | IKP 2024 | Change | Availability | Affordability | Utilisation | Rank (of 514) | Status 2026 |
|---|---|---|---|---|---|---|---|---|
| Jayawijaya Regency | 43.1 | 38.3 | +4.9 | 20.5 | 70.3 | 39.0 | 498 | Very vulnerable |
| Yalimo Regency | 41.1 | 44.9 | -3.8 | 20.3 | 65.8 | 37.5 | 500 | Very vulnerable |
| Pegunungan Bintang Regency | 38.9 | 34.1 | +4.8 | 18.1 | 74.8 | 24.4 | 501 | Very vulnerable |
| Lanny Jaya Regency | 38.4 | 38.2 | +0.3 | 25.1 | 60.8 | 29.7 | 502 | Very vulnerable |
| Yahukimo Regency | 35.3 | 30.9 | +4.3 | 19.9 | 56.5 | 29.9 | 507 | Very vulnerable |
| Tolikara Regency | 31.8 | 30.1 | +1.7 | 17.6 | 63.1 | 15.1 | 510 | Very vulnerable |
| Mamberamo Tengah Regency | 29.4 | 35.5 | -6.1 | 14.7 | 53.5 | 20.2 | 512 | Very vulnerable |
| Nduga Regency | 27.8 | 30.5 | -2.7 | 13.4 | 52.1 | 18.3 | 513 | Very vulnerable |
Food security index scores in South Papua province
| Regency or city | IKP 2026 | IKP 2024 | Change | Availability | Affordability | Utilisation | Rank (of 514) | Status 2026 |
|---|---|---|---|---|---|---|---|---|
| Merauke Regency | 69.3 | 65.1 | +4.3 | 68.5 | 66.2 | 73.3 | 360 | Somewhat resilient |
| Asmat Regency | 51.3 | 44.2 | +7.1 | 44.3 | 65.0 | 44.9 | 489 | Vulnerable |
| Boven Digoel Regency | 48.1 | 43.4 | +4.7 | 25.2 | 67.5 | 52.0 | 494 | Vulnerable |
| Mappi Regency | 42.0 | 37.2 | +4.9 | 28.9 | 56.8 | 40.5 | 499 | Very vulnerable |
Source: Badan Pangan Nasional, IKP Kabupaten/Kota 2024–2026 (12 indicators). Papua Movement translated the status labels.
What the index measures
The IKP scores each regency and city from 0 to 100 using 12 indicators grouped into three parts, according to the agency’s food security atlas. Availability compares the food available locally, including rice, maize, cassava, sweet potato, sago and bananas, with what residents need. Affordability covers poverty, price variation and undernourishment. Utilisation covers women’s schooling, access to clean water, food safety, diet quality and child stunting. Finally, the agency groups areas into six categories, from very vulnerable to very resilient.
Notes and limits
- Provincial and regional figures are simple averages of regency and city scores, so they do not reflect population size.
- Single-year changes for one regency can be large. Tolikara’s availability score, for example, went from 21.3 in 2024 to 43.9 in 2025 and back to 17.6 in 2026. Trends are best read over the full three years.
- In addition, production and survey data are harder to collect in remote areas, and the availability measure does not count subsistence crops such as taro.
- The dataset page does not state a licence. Please cite the National Food Agency as the original source, and Papua Movement for the extract and averages.
How to cite this data
Papua Movement (2026). Papua Food Security Index by Regency, 2024–2026. Data from Badan Pangan Nasional (National Food Agency), Indeks Ketahanan Pangan Kabupaten/Kota 2024–2026. https://papuamovement.com/papua-food-security-data/
How this page was made: the data were extracted and averaged with the help of AI tools and checked against the source dataset. Corrections: [email protected].